
Overview
Two complementary views: automatic container metrics for everything you deploy on App Platform, and monitor keys for observing your own external applications.
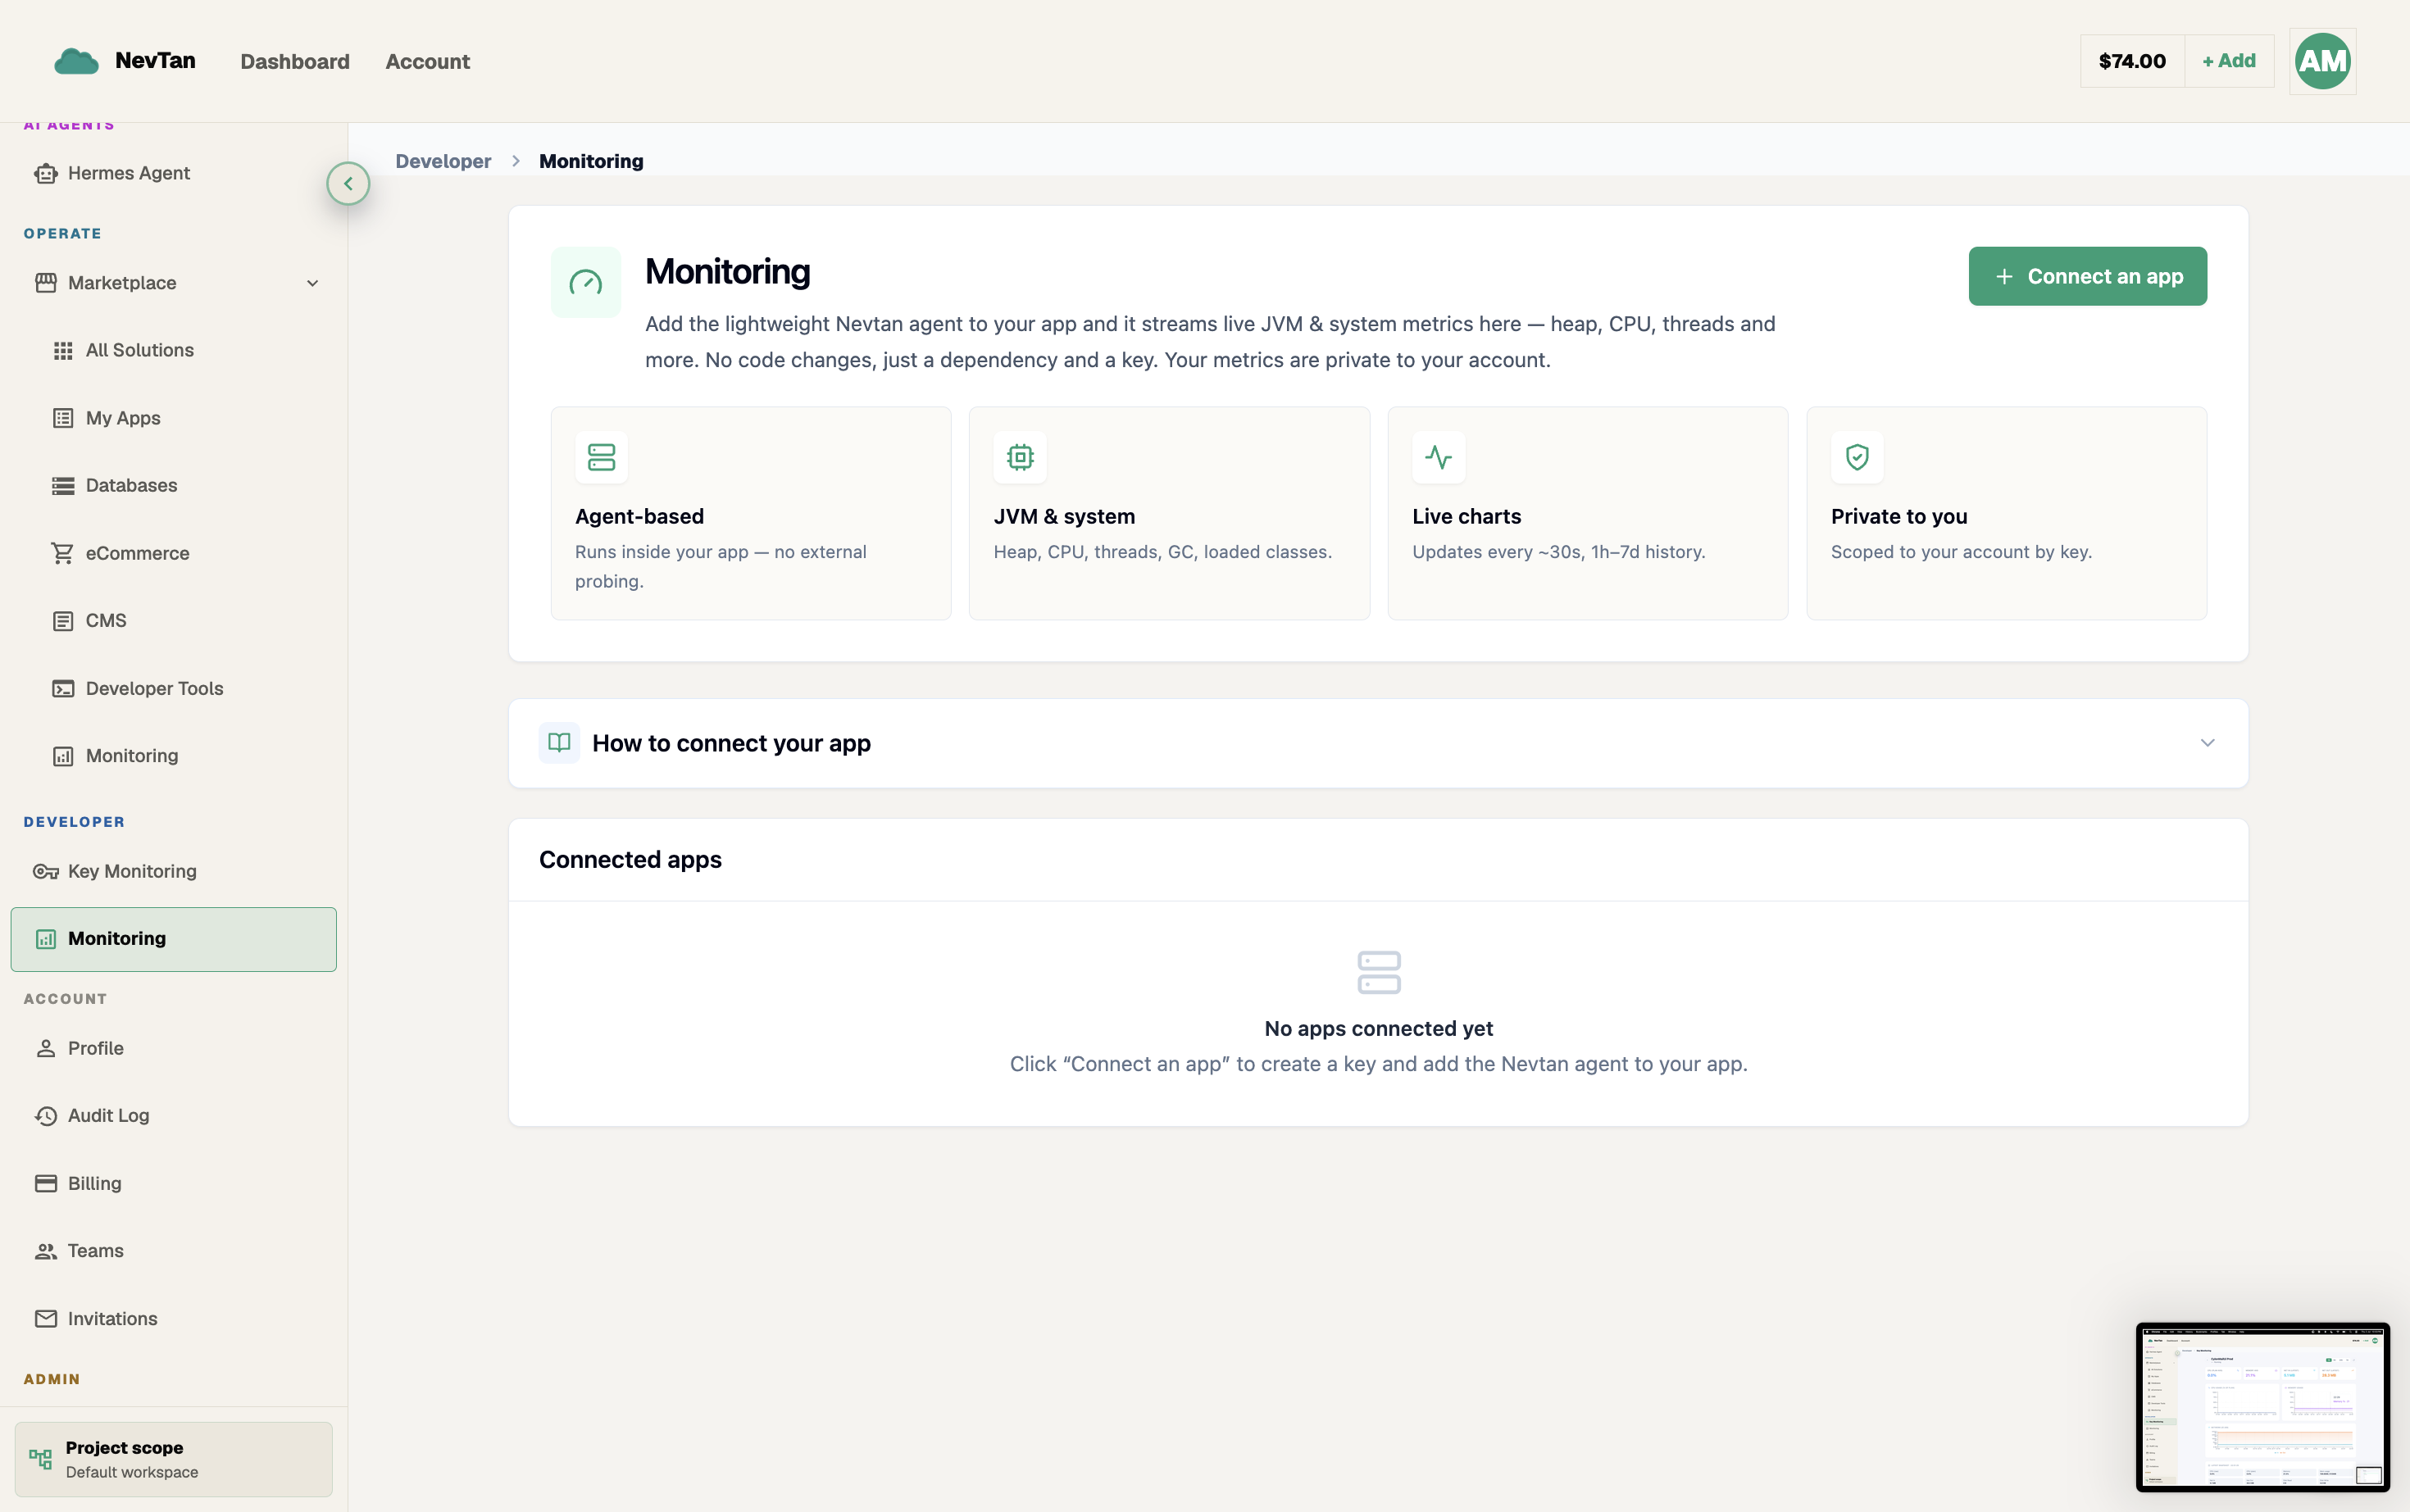
NevTan Cloud gives you two complementary layers of monitoring. The first is automatic — every project you deploy on App Platform streams CPU, memory, and network metrics to its dashboard with nothing to configure. The second is opt-in — create a monitor key from the console, install the NevTan monitoring agent alongside your own app, and its health shows up in NevTan right next to everything else.
Why observability matters
A service that isn't observed is a service you find out about from your users. Metrics turn "the app feels slow" into a chart you can act on:
- Catch resource exhaustion before it's an outage — a memory curve climbing steadily toward its limit, or CPU pinned at 100%, is your warning to resize or investigate before the container is stopped or requests start timing out.
- Debug incidents faster — when something breaks, correlating a spike in memory or network with the moment users reported errors turns a guessing game into a five-minute root-cause.
- Plan capacity ahead of need — a week of history showing your baseline load tells you when to move up a resource preset or turn on auto-scaling, instead of reacting after the fact.
A concrete scenario: catching a leak before it becomes an outage
Say a background job in your app fails to release a connection pool entry on every request. Nothing looks wrong at first — the app responds normally, tests pass, and there's no error to notice. Without metrics, the first sign of trouble is usually a page from your users when the container finally runs out of memory, gets killed, and restarts mid-traffic.
With the memory chart open, the same failure looks completely different: a slow, steady upward slope across a day or two, well before anything actually breaks. That shape — climbing and never falling back after a request finishes — is the signature of a leak, as opposed to a normal sawtooth that rises under load and drops back down after garbage collection or a request completes. Spotting the slope on day one buys you time to ship a fix on your own schedule, instead of debugging a crash loop at 2 a.m. while the container keeps restarting under load.
How the two layers differ
The two layers
CPU, memory, and network charts for a single project or across all your projects — captured automatically for every App Platform deployment.
Create a key for an app you run outside NevTan, see it listed with a live up/down status, and view its metrics.
Install the NevTan monitoring agent alongside your own app and point it at a monitor key — no calls to write by hand.
The uptime and health dashboard built on monitor keys — up/down status and latency for every app you've instrumented.
The other half of the picture: your projects' log lines charted together on a shared Grafana dashboard.
Which layer do I need?
| You want to… | Use |
|---|---|
| See CPU/memory of an app you deployed here | Container metrics — no setup |
| Monitor an app you run on your own infrastructure | A monitor key + the NevTan agent |
| Track uptime and latency across instrumented apps | Key monitoring |