Monitoring
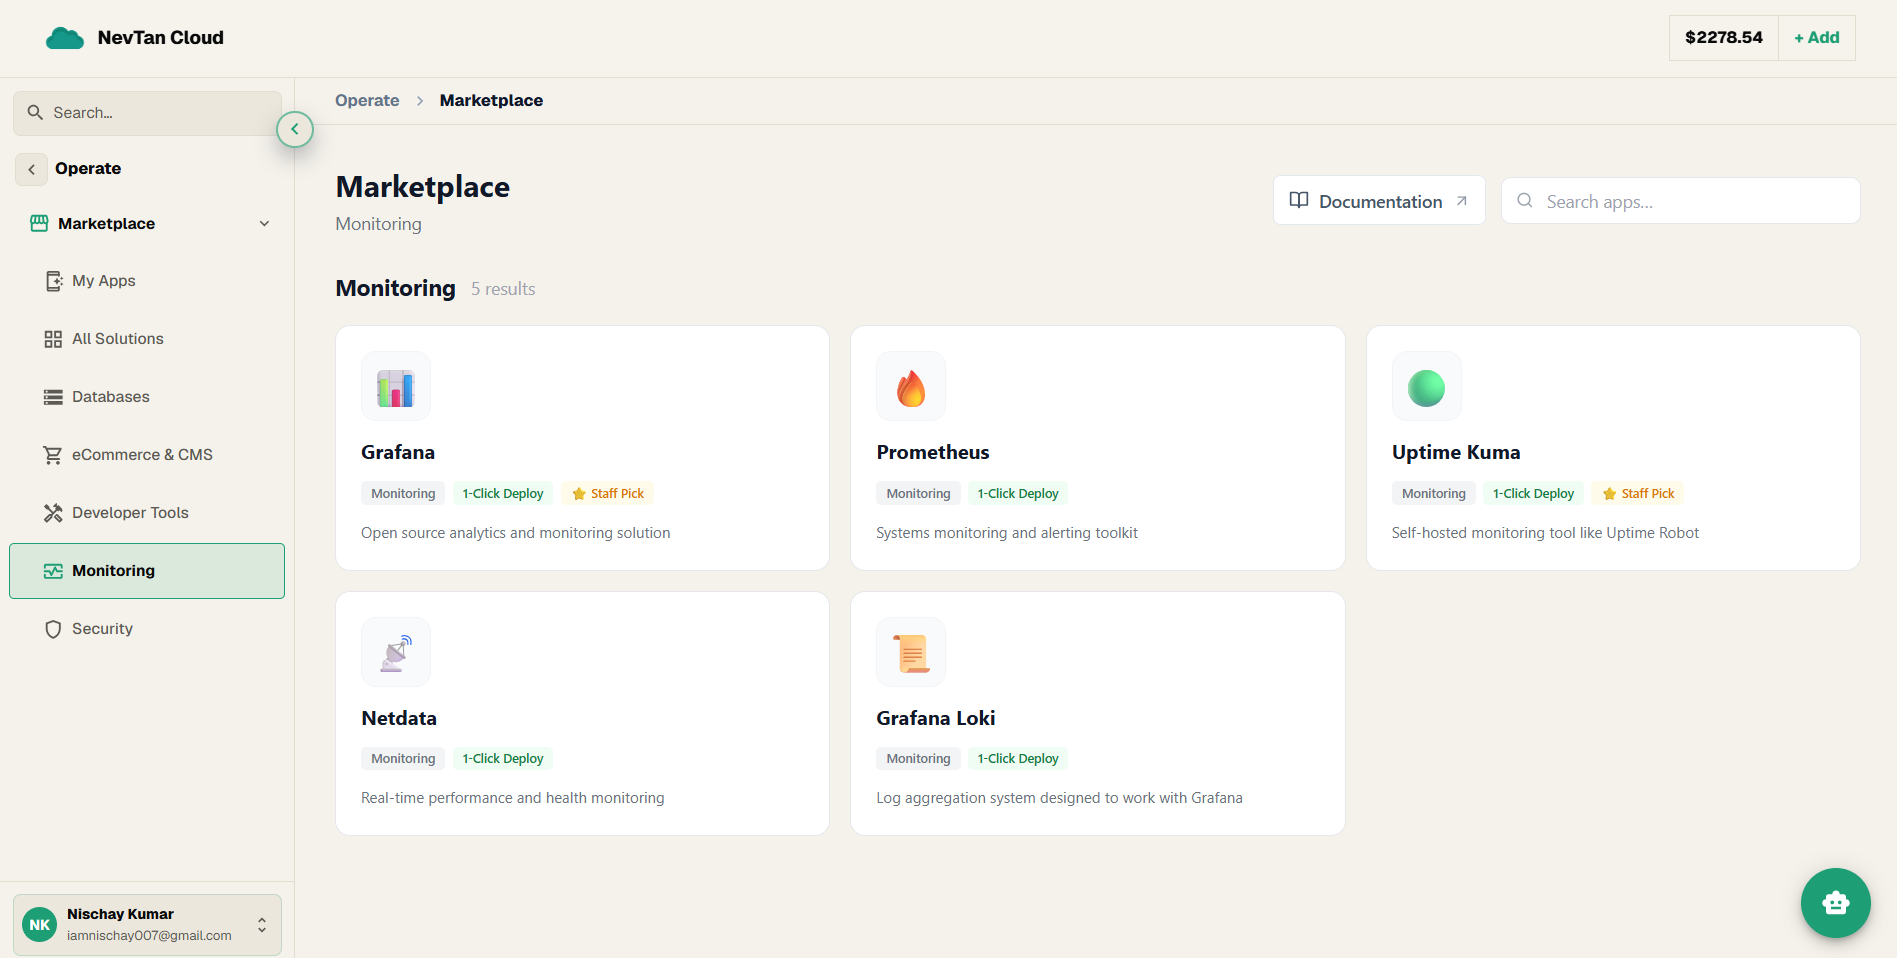
Deploy monitoring and observability tools in one click — Grafana, Prometheus, Uptime Kuma, Netdata, and Grafana Loki.
The Monitoring category is five tools for watching your own infrastructure — dashboards, metrics collection, uptime checks, real-time host monitoring, and log aggregation — each a single-click deploy.
Apps in this category
| App | Deploy type | What it is |
|---|---|---|
| Grafana | 1-Click Deploy | Open source analytics and monitoring solution |
| Prometheus | 1-Click Deploy | Systems monitoring and alerting toolkit |
| Uptime Kuma | 1-Click Deploy | Self-hosted monitoring tool like Uptime Robot |
| Netdata | 1-Click Deploy | Real-time performance and health monitoring |
| Grafana Loki | 1-Click Deploy | Log aggregation system designed to work with Grafana |
Every app in this category, explained
📊 Grafana
Grafana turns metrics (numbers collected over time, like CPU usage or request counts) into dashboards — charts and graphs you can watch to understand how your systems are behaving. On its own it doesn't collect data; it displays data collected by something else, most commonly Prometheus (below).
🔥 Prometheus
Prometheus is a metrics collection and alerting engine — it regularly "scrapes" (pulls) numbers from your services and stores them over time as time-series data (data points ordered by when they happened), so you can look back at trends or set up alerts when a number crosses a threshold.
🟢 Uptime Kuma
Uptime Kuma repeatedly checks whether a website or service is up (reachable) and tells you when it goes down — a self-hosted alternative to hosted uptime-checking services.
📡 Netdata
Netdata shows real-time, per-second performance and health data for a server and the services running on it, with detailed dashboards that update continuously rather than on a delay.
📜 Grafana Loki
Grafana Loki is a log aggregation system — it collects the log lines your services write and indexes them so you can search across all of them in one place, instead of opening each server separately. It is built to pair with Grafana, which can display those logs next to your metrics.
Deploying a tool, in short
All five apps here use the standard 1-Click form — a name, a region, and a size, with optional environment variables. For the complete, field-by-field walkthrough with screenshots, see Guide 2 on Deploying apps. A common setup runs Prometheus to collect metrics, Grafana Loki to collect logs, and Grafana to visualize both — deploy them, then add Prometheus and Loki as data sources in Grafana.