Key monitoring
The uptime and health dashboard built on monitor keys — up/down status and latency for every app you've instrumented.
Key Monitoring is the uptime and health view layered on top of your monitor keys. It rolls each key's recent activity into an at-a-glance up/down status and surfaces latency, so you can tell whether every app you've connected is alive and responsive.
How status is determined
- Up — the agent for that key has reported recently; the app is healthy and reachable.
- Down — no recent report; the app has stopped reporting, crashed, or lost connectivity.
- Latency — response and processing time surfaced from what the agent reports.
Why this matters
Uptime status turns silent failures into visible ones. If an instrumented app crashes, hangs, or loses network access, it stops reporting — the key flips to down here well before a user complaint reaches you, so you can treat it as an incident to debug rather than a surprise to discover.
What an outage actually looks like here
A healthy row sits quietly at up, with a latency figure that stays in a familiar range for that app. An outage doesn't always announce itself with a hard stop — it usually shows up first as a change in shape before the status flips:
- Latency climbing before a drop — response times trend upward over several readings as the app struggles, often the earliest hint that something is wrong, well before it stops reporting entirely.
- Status flips to down — no report has arrived in the expected window. This is the same signal whether the cause is a crash, a hang, or the app losing network access; from the dashboard's side it looks identical either way.
- A gap in the recent trend — the row's history shows a break where no data landed, which is the visual record of exactly when the app went quiet.
- Recovery — once the app is reachable and reporting again, the row flips back to up and latency settles back to its normal range, closing the gap in the trend.
In the console
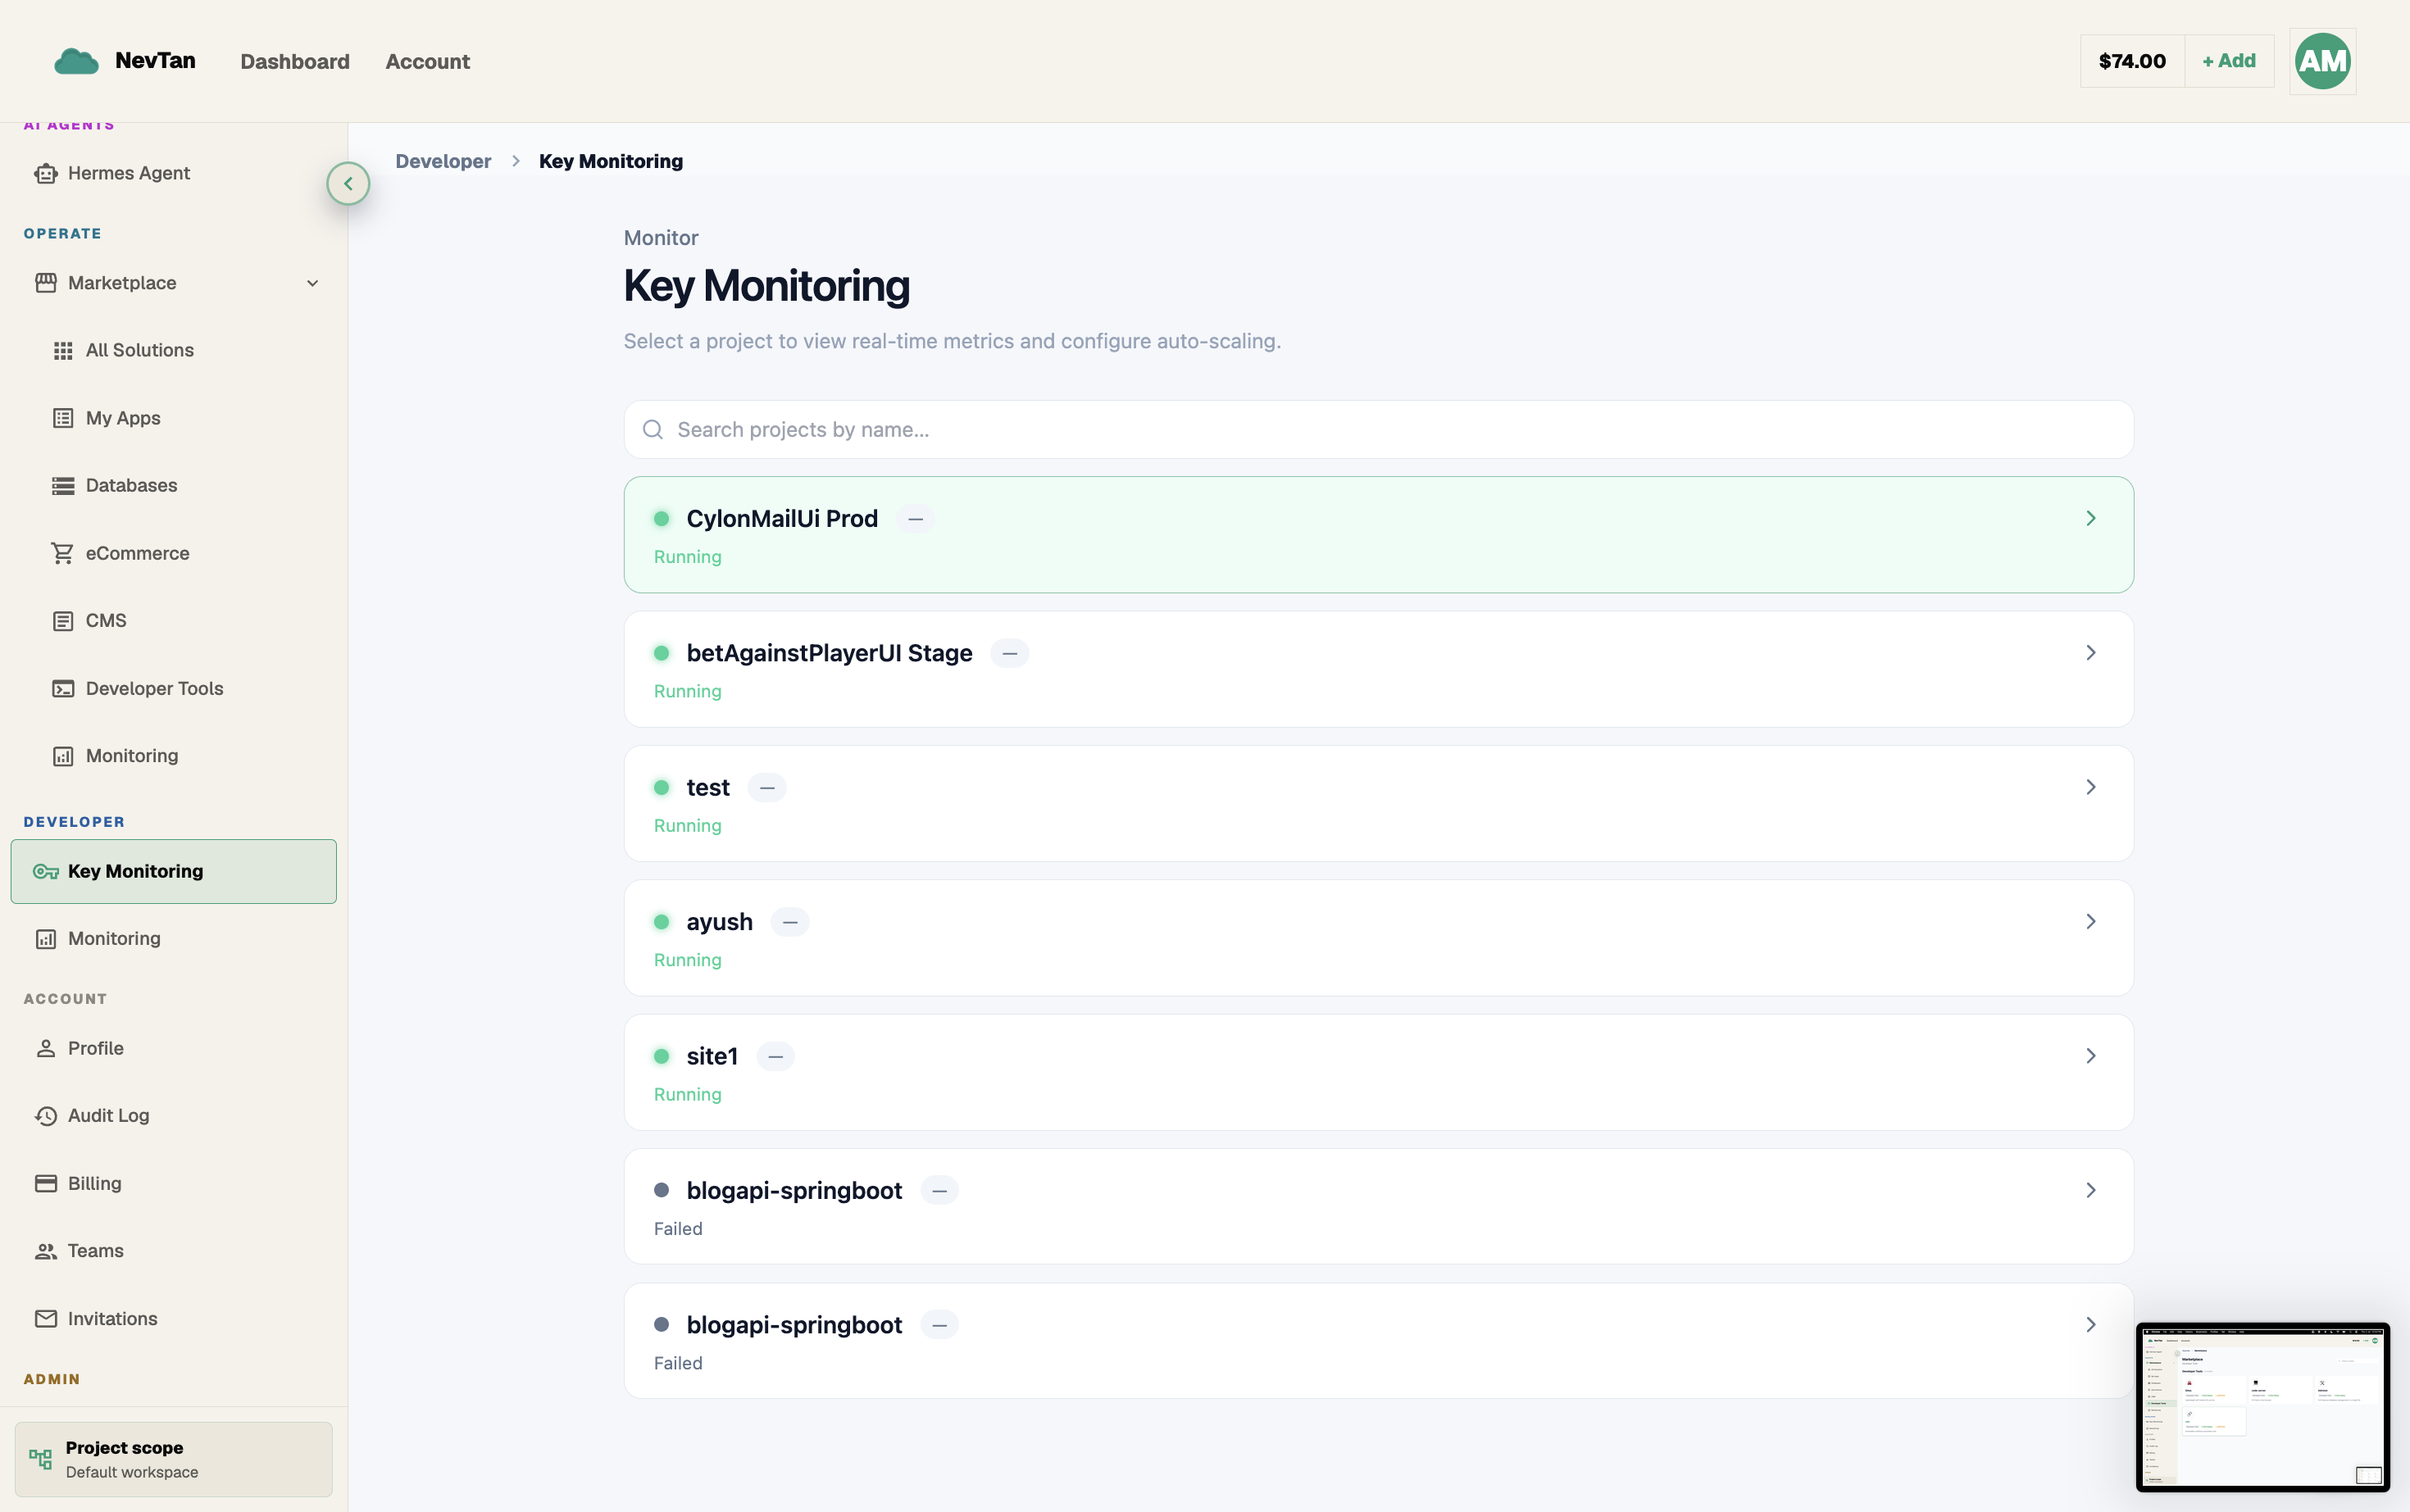
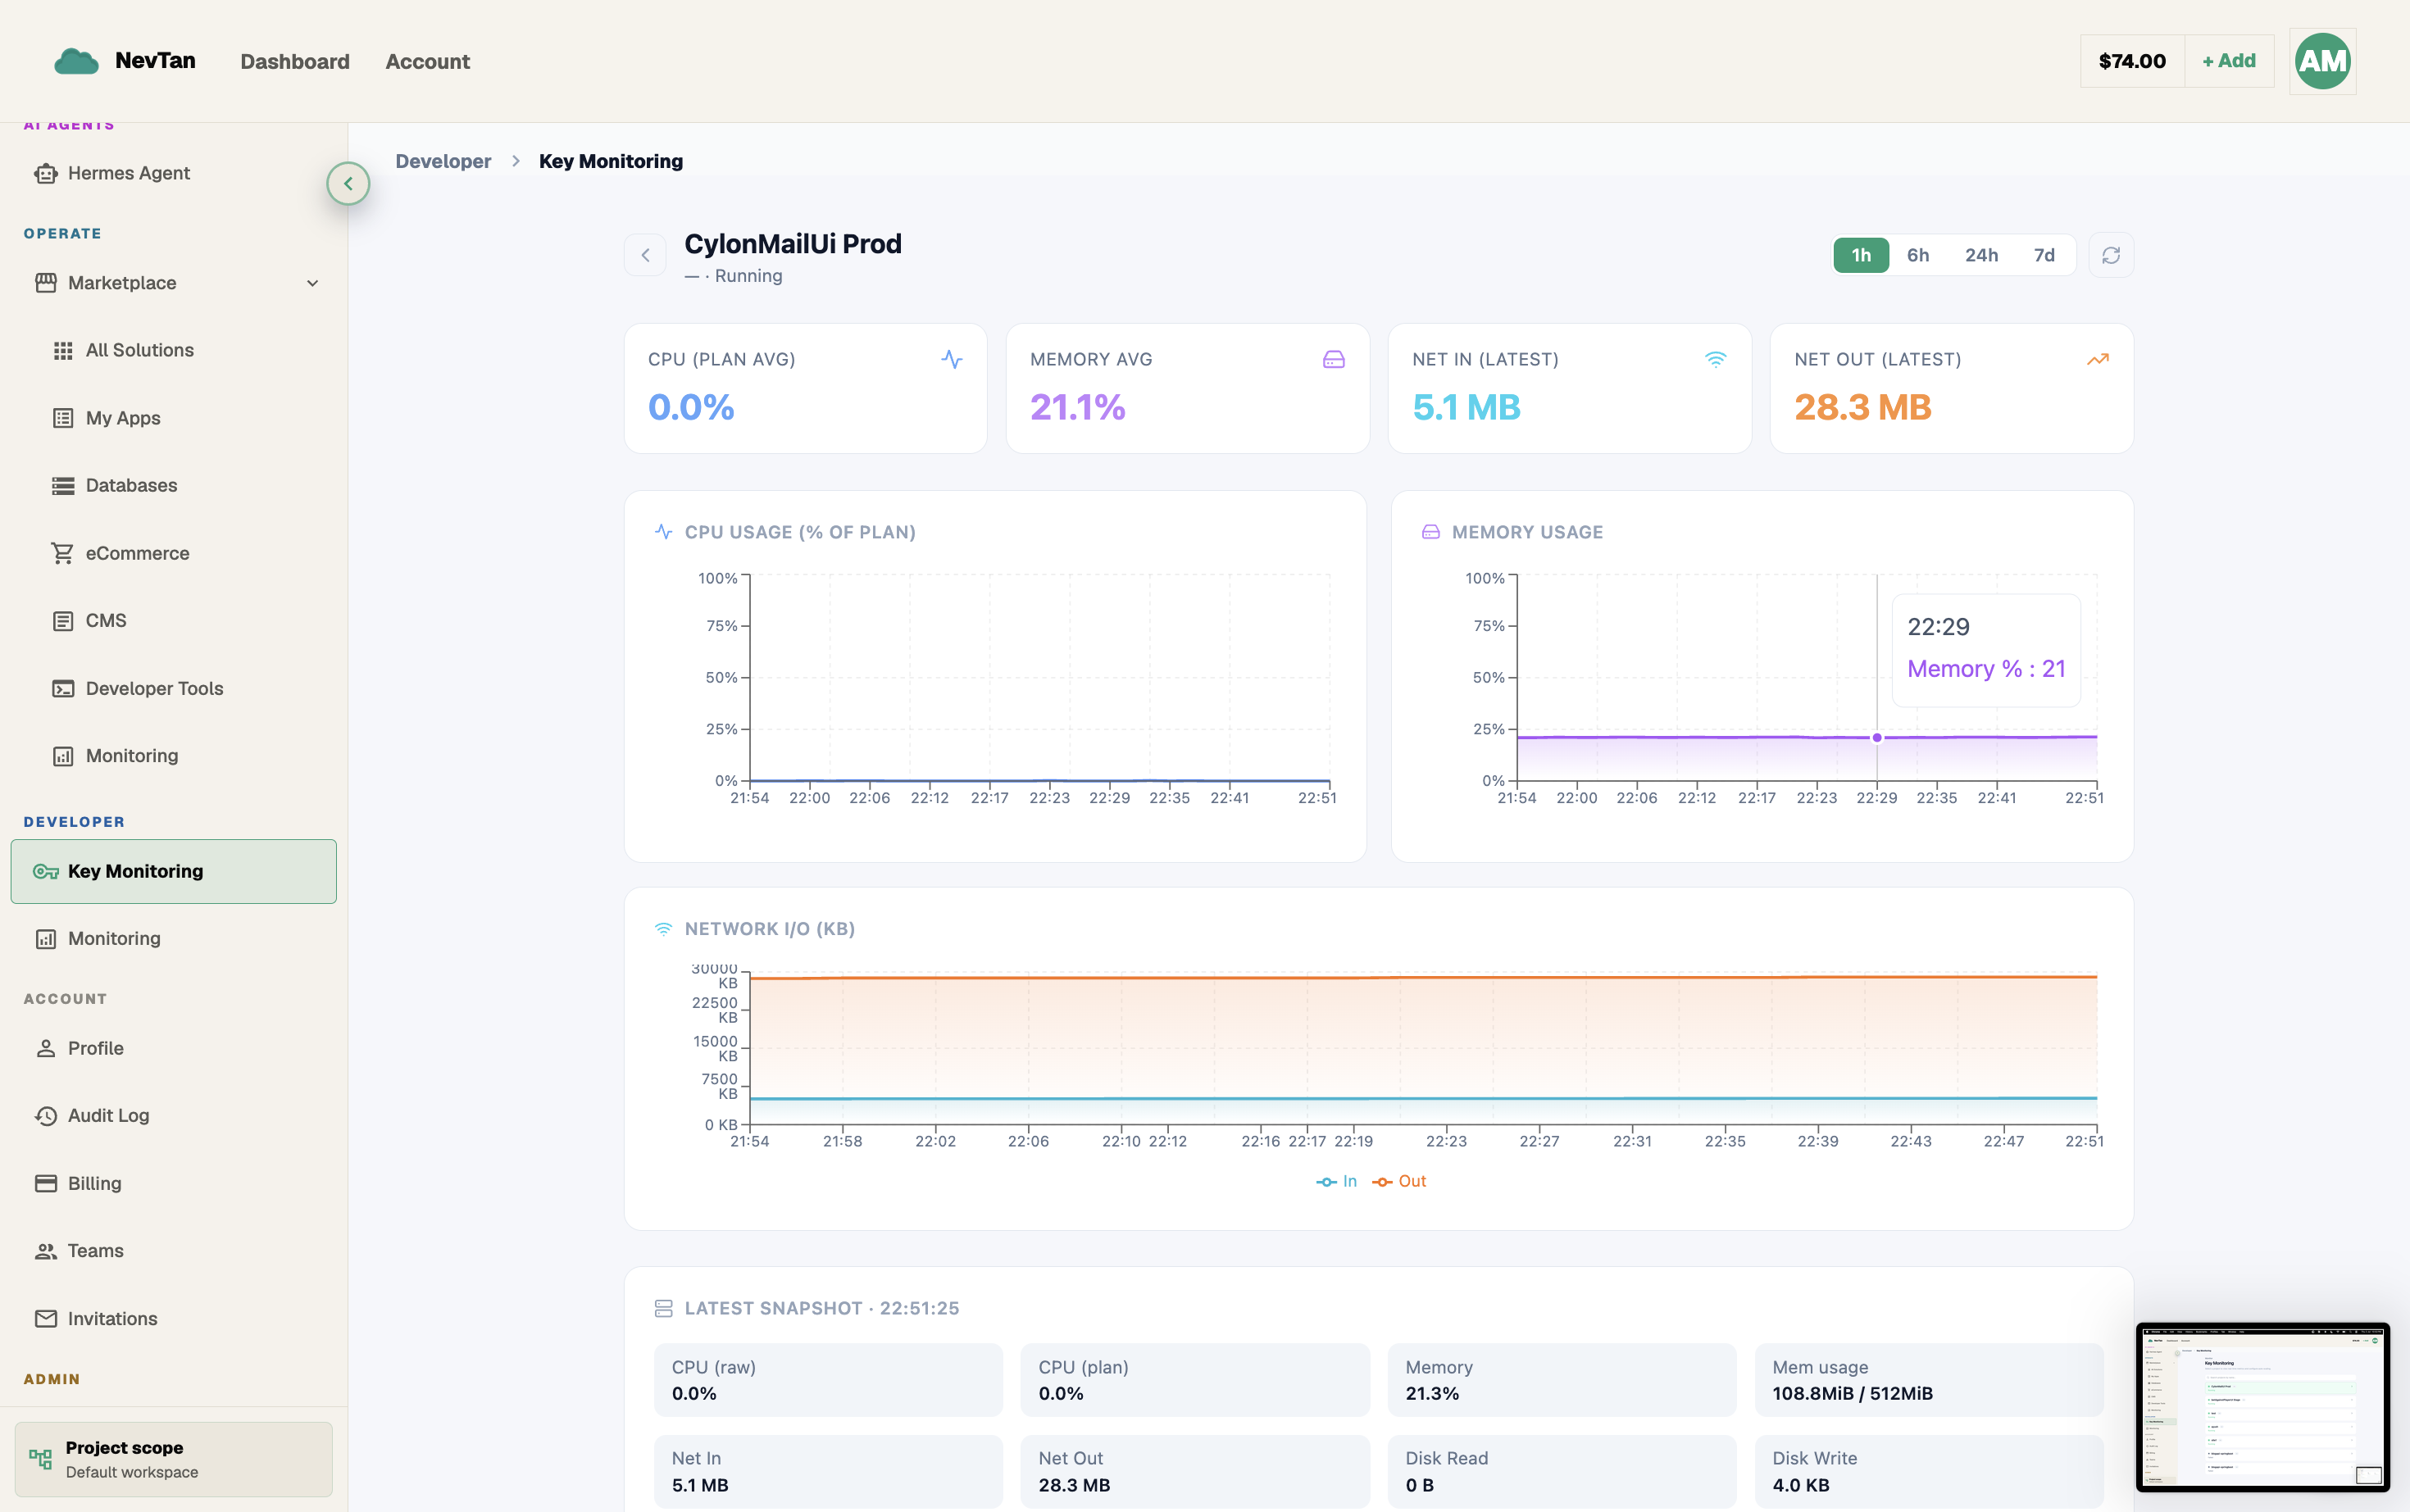
Open the Key Monitoring page to see every monitor key as a row with its live status, latency, and recent trend. Each row maps to a key from Monitor keys; click one to drill into its metrics.