Monitoring AI inference performance means continuously tracking latency, throughput, GPU utilization, token generation speed, error rates, and cost per request across a production AI system. Effective monitoring combines metrics collection, centralized logging, distributed tracing, and alerting tied to defined SLOs, so teams catch degradation before it affects users. Platforms like NevTan Cloud build this observability directly into the infrastructure layer, removing the need to assemble separate monitoring tools for GPU-backed AI workloads.
Introduction
Production AI applications have moved well past the experimental stage — LLM-powered chatbots, RAG systems, and AI agents now handle real customer interactions and business-critical workflows around the clock. As that adoption grows, monitoring AI inference performance has become a core operational requirement, not an afterthought.
Poor observability has real costs: undetected latency creep degrades customer experience, GPU waste from over-provisioning quietly inflates cloud bills, and unmonitored error rates can turn a minor bug into a full outage before anyone notices. Slow AI responses directly hurt conversion and retention in customer-facing products, while blind spots in capacity planning leave teams scrambling during traffic spikes instead of scaling smoothly.
The underlying demand curve makes this harder every quarter. GPU-backed inference is now the single largest infrastructure cost line for many AI-native companies, and capacity is often the binding constraint rather than budget alone — teams that can't see GPU utilization in real time end up either over-provisioning defensively or getting caught flat-footed during a traffic spike. At the same time, user expectations for AI response times have converged with expectations for any other web application: a chatbot that takes four seconds to produce a first token feels broken, even if the underlying model is state-of-the-art. Infrastructure that was never designed for GPU-backed, bursty, token-by-token workloads — traditional web monitoring stacks chief among them — struggles to surface the specific signals (TTFT, VRAM pressure, batching efficiency) that actually explain AI performance problems.
This guide covers what monitoring AI inference performance actually requires in production: the metrics that matter, the architecture behind effective AI observability, common bottlenecks, tool comparisons, and how NevTan Cloud, an AI cloud platform built for production AI workloads, simplifies this entire discipline. For a broader look at the platform, see Why Choose NevTan Cloud.
What Is AI Inference Performance?
AI inference performance refers to how efficiently a deployed model processes requests and returns results, measured across latency, throughput, resource utilization, and reliability dimensions.
Inference latency: the total time from request submission to response completion.
Throughput: the number of requests or tokens a system can process per unit of time.
Tokens per second (TPS): the rate at which an LLM generates output tokens during a response.
Requests per second (RPS): the volume of API calls the system handles concurrently.
GPU utilization: the percentage of available GPU compute actively engaged in inference.
CPU utilization: processor load from request handling, preprocessing, or non-GPU operations.
Memory usage: system RAM consumed during request processing.
Queue time: how long a request waits before inference begins.
Cold starts: the delay incurred when a new model server instance must load a model before serving its first request.
Model response time: the time the model itself takes to generate a result, excluding network overhead.
API response time: the full round-trip time experienced by the calling application, including network and gateway overhead.
Key Takeaway: AI inference performance isn't a single number — it's a set of interconnected metrics spanning compute, network, and application layers that together determine what users actually experience.
Why Monitoring AI Inference Performance Matters
Monitoring AI inference performance matters because it directly determines customer experience, infrastructure cost, and the reliability of every product built on top of the model.
Faster customer experiences: identifying latency regressions early keeps response times within acceptable bounds.
Cost optimization: visibility into GPU utilization prevents both under- and over-provisioning.
SLA compliance: continuous monitoring is the only way to verify uptime and latency commitments are actually being met.
Error detection: catching elevated error rates before they compound into a broader outage.
Capacity planning: historical metrics inform how much GPU capacity to provision ahead of anticipated demand.
GPU efficiency: utilization data highlights opportunities to consolidate workloads or right-size instances.
Autoscaling decisions: accurate real-time metrics are what make autoscaling policies actually effective.
Reliability: monitoring is the foundation of any meaningful incident response process.
Business continuity: production AI outages increasingly translate directly into lost revenue and customer trust.
Real-world scenario: an AI chatbot's response times creep from 800ms to 4 seconds over several weeks as usage grows, but without latency monitoring tied to alerts, the team only learns about it from customer complaints — after churn has already started. With TTFT and end-to-end latency tracked against an SLO, the same degradation would trigger an alert days earlier, before it affected a meaningful number of users.
A second common pattern shows up around capacity planning rather than incidents: a team provisions GPU capacity based on a rough estimate at launch, then never revisits it. Six months later, utilization monitoring would show that half the fleet sits idle overnight while the other half saturates during business hours — a pattern invisible without historical metrics, and one that a properly tuned autoscaling policy driven by real utilization data would have handled automatically.
Key Metrics Every AI Team Should Monitor
The table below lists the core metrics production AI teams should track, spanning performance, resource utilization, and reliability.
Metric | What It Measures | Why It Matters |
|---|---|---|
Latency | Time from request receipt to response returned | Directly affects user experience and SLA compliance |
Throughput | Number of requests processed per unit time | Indicates system capacity under real load |
GPU Utilization | Percentage of GPU compute actively used | Reveals under- or over-provisioning of GPU capacity |
CPU Usage | Processor load on serving instances | Identifies non-GPU bottlenecks in the request pipeline |
Memory Usage | RAM consumption during inference | Prevents out-of-memory failures under load |
VRAM Consumption | GPU memory used by loaded models | Determines how many models/instances fit per GPU |
Token Generation Speed | Tokens produced per second by an LLM | Core performance indicator for generative workloads |
Request Volume | Total incoming requests over time | Drives autoscaling and capacity planning decisions |
Queue Length | Requests waiting for processing | Early warning sign of impending latency degradation |
Error Rate | Percentage of failed requests | Flags reliability issues before they escalate |
Success Rate | Percentage of successfully completed requests | Direct measure of service reliability |
Time to First Token (TTFT) | Delay before the first output token is returned | Major driver of perceived responsiveness in LLM apps |
Tokens Per Second (TPS) | Rate of token output during generation | Benchmark for comparing model/infrastructure efficiency |
Cost Per Request | Compute cost attributed to a single request | Enables accurate unit economics and pricing decisions |
API Availability | Percentage of time the API is reachable and functional | Core input to SLA and uptime commitments |
Uptime | Total system availability over a period | Business continuity and customer trust metric |
Cache Hit Rate | Percentage of requests served from cache | Indicates efficiency gains from caching layers |
Autoscaling Events | Frequency and pattern of scale-up/scale-down actions | Reveals whether scaling policy matches real demand |
Key Takeaway: No single metric tells the full story — latency without GPU utilization context, or error rate without queue length, can each mask the real root cause of a performance issue.
AI Observability Architecture
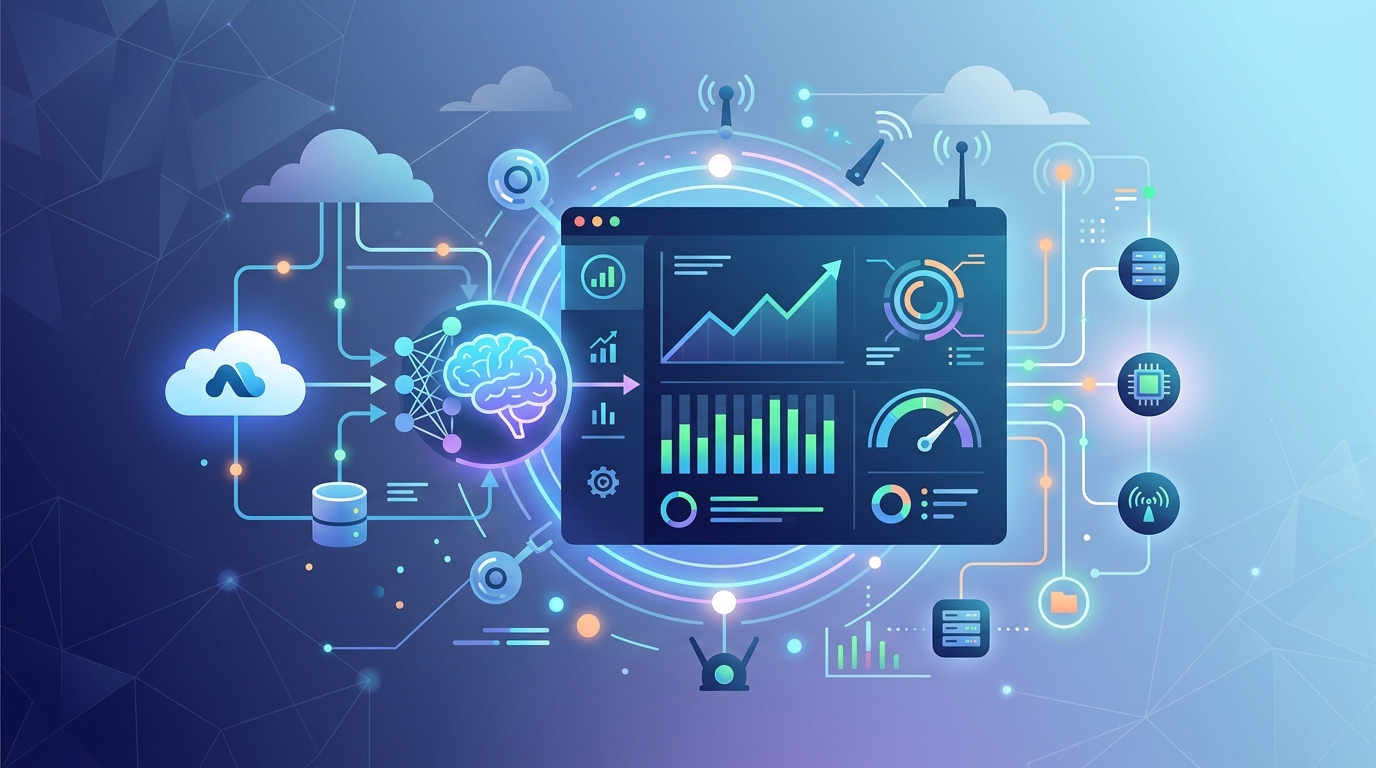
A complete AI observability architecture combines metrics collection, logging, distributed tracing, and alerting across every layer of the inference stack, surfaced through dashboards that teams actually use.
Metrics collection: continuously gathers latency, throughput, GPU, and error-rate data from every service.
Logging: captures structured request and system logs for debugging and audit.
Distributed tracing: follows individual requests across the gateway, model server, and downstream services.
Alerts: notify teams automatically when metrics breach defined thresholds.
Dashboards: visualize real-time and historical performance for fast diagnosis.
GPU telemetry: tracks utilization, VRAM consumption, and temperature at the hardware level.
Container monitoring: tracks resource usage and health at the container/pod level.
API monitoring: tracks endpoint-level latency, error rates, and traffic patterns.
Database monitoring: tracks query latency and connection health for any backing data stores.
Network monitoring: tracks bandwidth, packet loss, and latency between services.
These layers work best when they're connected rather than siloed: a latency spike surfaced in a dashboard should let an engineer jump directly into the relevant trace, and from there into the specific logs for that request, without switching between three unrelated tools and manually correlating timestamps. That correlation — metrics pointing to traces pointing to logs — is usually the difference between a five-minute diagnosis and a two-hour one during an incident.
Architecture Diagram Description (for designers)
A layered diagram. Top row: "API Gateway" and "Load Balancer" boxes feeding into a row of "AI Model Server" boxes with small GPU icons. Each model server connects downward into a "GPU Telemetry" band and a "Container Monitoring" band. To the right, parallel boxes for "Database Monitoring" and "Network Monitoring" connect back to the model servers. Running beneath the entire stack: a wide "Metrics Collection" band feeding into a "Logging & Distributed Tracing" band, which feeds into a "Dashboards & Alerts" box at the very bottom, styled as a monitor/screen icon. Arrows point upward from every component into the metrics band, indicating continuous telemetry flow. Blue and teal corporate palette, flat vector style, no embedded text.
Learn more About NevTan Cloud or review pricing for observability-included production infrastructure.
Common AI Inference Performance Bottlenecks
Most AI inference performance problems trace back to a small set of recurring bottlenecks — GPU saturation, inefficient scaling, and slow supporting infrastructure chief among them.
GPU saturation: too many concurrent requests for available GPU capacity, causing queuing and latency spikes. Troubleshooting tip: monitor GPU utilization trends and add capacity or batch more efficiently before saturation becomes chronic.
CPU bottlenecks: preprocessing or tokenization work overwhelming CPU resources ahead of the GPU stage. Tip: profile the request pipeline to isolate CPU-bound steps.
Slow storage: delays loading model checkpoints or retrieving RAG documents from disk. Tip: use faster storage tiers or cache frequently accessed artifacts.
Large model sizes: bigger models increase both latency and VRAM requirements. Tip: evaluate quantization or smaller model variants where accuracy tradeoffs are acceptable.
Inefficient prompts: unnecessarily long prompts increase token processing time and cost. Tip: audit and trim prompt templates regularly.
Network latency: distance between clients, gateways, and model servers adds overhead. Tip: deploy inference closer to users where latency is critical.
Database bottlenecks: slow queries in supporting databases delay request completion. Tip: monitor query latency and add appropriate indexing or caching.
Queue congestion: requests backing up faster than they can be processed. Tip: monitor queue length as an early warning signal, not just latency.
Poor autoscaling: scaling policies that react too slowly or on the wrong metrics. Tip: tie autoscaling to GPU utilization and queue depth, not just CPU.
Memory fragmentation: inefficient GPU memory allocation over time reducing effective capacity. Tip: monitor VRAM trends and restart or rebalance instances periodically.
Best Practices for Monitoring AI Inference
Consistently monitoring AI inference performance requires more than collecting metrics — it requires defined targets, centralized visibility, and a habit of acting on what the data shows.
Define SLOs and SLAs: set explicit internal targets and external commitments for latency and availability.
Monitor end-to-end latency: track the full request path, not just model inference time.
Track token generation: monitor TTFT and TPS specifically for LLM-based workloads.
Monitor GPU utilization: treat GPU metrics as a first-class signal, not an afterthought.
Enable distributed tracing: make it possible to pinpoint exactly where latency is introduced.
Centralize logs: avoid scattered logs across services that make root-cause analysis slow.
Configure alerts: set thresholds that trigger before users notice a problem, not after.
Capacity planning: use historical trends to provision ahead of predictable demand growth.
Continuous optimization: treat monitoring data as ongoing input for tuning, not a one-time setup.
Ready to Monitor Your AI Workloads? See how NevTan Cloud's built-in observability works →
How NevTan Cloud Simplifies AI Monitoring
NevTan Cloud builds AI-specific observability directly into the platform, so teams get production-grade monitoring without assembling and maintaining a separate tooling stack.
Built-in monitoring: latency, throughput, and error rates are tracked automatically for every deployed workload.
Centralized logging: structured logs across the entire stack are available in one place.
GPU metrics: utilization and VRAM consumption are surfaced in real time without extra configuration.
Autoscaling dashboards: see scaling events and the metrics that triggered them in context.
Infrastructure observability: container, network, and database health are visible alongside application metrics.
Performance analytics: historical trends support capacity planning and optimization decisions.
Security monitoring: access and configuration changes are logged for audit purposes.
Managed infrastructure: the underlying observability stack is maintained by the platform, not your team.
Developer-friendly dashboards: metrics are presented in a way engineers can act on immediately.
Enterprise reliability: monitoring is built to support formal SLAs, not just internal visibility.
Step-by-Step Guide
Setting up AI inference monitoring on NevTan Cloud follows a straightforward sequence from deployment through continuous improvement.
1. Deploy workload — launch your model or AI API on the platform.
2. Configure monitoring — enable metrics, logging, and tracing for the deployment.
3. Define metrics — select the latency, throughput, GPU, and error-rate metrics relevant to your workload.
4. Set alerts — configure thresholds tied to your SLOs for automatic notification.
5. Analyze dashboards — review real-time and historical performance data.
6. Optimize performance — adjust batching, caching, or instance sizing based on findings.
7. Scale automatically — let autoscaling policies respond to real-time demand signals.
8. Continuous improvement — revisit metrics regularly as usage patterns evolve.
Security & Compliance
Monitoring infrastructure itself needs to be secured, since logs and metrics often contain sensitive request data and operational details attackers could exploit.
Audit logs: maintain records of who accessed monitoring data and when.
Monitoring access: restrict dashboard and log access based on role.
Encryption: protect metrics and log data in transit and at rest.
Compliance: align monitoring data retention and access with relevant regulatory requirements.
IAM: apply least-privilege access controls to observability tooling.
Secrets management: ensure monitoring configurations don't expose credentials in logs.
AI data privacy: avoid logging sensitive prompt or response content without proper controls.
Incident response: use monitoring data as the foundation for a documented response process.
Review NevTan Cloud's Security practices, Trust Center, Privacy Policy, and AI Data Policy for how these controls are implemented.
Enterprise Procurement: Reviewing NevTan Cloud for enterprise use? See our Terms of Service, Acceptable Use Policy, Cookie Policy, and Cloud Subprocessors for procurement and legal review.
Cost Optimization Through Monitoring
Observability directly reduces AI infrastructure costs by exposing exactly where GPU capacity, API reliability, and provisioning decisions are wasting money.
GPU waste: utilization monitoring reveals idle or underused GPU capacity that can be consolidated.
Infrastructure costs: visibility into resource usage supports right-sizing instances instead of over-provisioning by default.
API failures: catching elevated error rates early avoids retry storms that inflate compute costs.
Downtime: faster incident detection reduces the business cost of outages.
Overprovisioning: historical demand data replaces guesswork in capacity planning.
Cloud spending: cost-per-request visibility supports accurate unit-economics decisions.
In practice, the cost impact of observability tends to compound: a team that catches GPU under-utilization early might right-size one deployment and save a modest amount, but the same visibility applied consistently across every workload — combined with autoscaling tuned against real metrics rather than static thresholds — typically has a much larger effect on total infrastructure spend than any single optimization.
See current AI cloud pricing for a predictable, monitoring-included alternative to assembling your own observability stack.
Real-World AI Monitoring Use Cases
AI Chatbots: monitoring latency and error rates directly protects customer-facing experience quality.
AI Agents: monitoring tool-call latency and success rates is essential for multi-step autonomous workflows — see NevTan Cloud's AI Agents platform for agent-specific observability.
RAG Systems: tracking retrieval latency alongside generation latency isolates which stage is the bottleneck.
Document AI: monitoring throughput and error rates for high-volume batch document processing.
Voice AI: tracking TTFT and end-to-end latency is critical for natural conversational timing.
Healthcare AI: audit logging and uptime monitoring support compliance-sensitive clinical workflows.
FinTech AI: error rate and latency monitoring under strict regulatory and reliability expectations.
Fraud Detection: monitoring throughput ensures real-time scoring keeps pace with transaction volume.
Recommendation Engines: latency monitoring directly impacts real-time personalization quality.
Enterprise Copilots: monitoring usage patterns and performance across internal, high-expectation users.
Why Choose NevTan Cloud
Enterprises choose NevTan Cloud for AI observability because it removes the burden of assembling GPU-aware monitoring, logging, and tracing tools from scratch — replacing months of tooling work with production-ready visibility from day one.
Purpose-built observability for GPU-backed inference workloads, not retrofitted general-purpose monitoring
Built-in dashboards, alerts, and tracing without separate tool integration
Predictable pricing that includes monitoring rather than billing it as a costly add-on
Enterprise-grade reliability, security, and support behind every deployed workload
Why Choose NevTan Cloud? Monitoring, autoscaling, and GPU observability are native to the platform — not assembled from separate vendors. Get started with NevTan Cloud →
Frequently Asked Questions
How do you monitor AI inference performance?
By tracking latency, throughput, GPU utilization, error rates, and token generation speed through a combination of metrics collection, logging, distributed tracing, and dashboards, with alerts configured against defined SLOs.
What are the best AI inference monitoring tools?
Options range from open-source stacks like Prometheus, Grafana, and OpenTelemetry to commercial platforms like Datadog and New Relic, and AI-native platforms like NevTan Cloud that provide built-in GPU and inference-specific observability.
What is Time to First Token (TTFT)?
TTFT is the delay between a request being sent and the first output token being returned by an LLM, a key driver of perceived responsiveness in generative AI applications.
Why does GPU utilization matter for AI monitoring?
GPU utilization reveals whether compute capacity is under-provisioned (causing latency) or over-provisioned (wasting cost), making it central to both performance and cost optimization.
How do you reduce AI inference latency?
By optimizing batching, right-sizing GPU instances, reducing prompt size where possible, using caching for repeatable requests, and ensuring autoscaling reacts quickly to demand.
What is AI observability?
AI observability is the practice of collecting metrics, logs, and traces across the AI inference stack to understand system behavior, diagnose issues, and make informed scaling and optimization decisions.
What causes AI inference performance bottlenecks?
Common causes include GPU saturation, CPU bottlenecks, slow storage, oversized models, inefficient prompts, network latency, and poorly tuned autoscaling policies.
How do you set SLOs for AI APIs?
By defining target thresholds for latency, error rate, and availability based on user experience requirements and business needs, then monitoring actual performance against those targets continuously.
What is distributed tracing in AI monitoring?
Distributed tracing follows a single request across every component it touches—gateway, model server, database—to pinpoint exactly where latency or errors are introduced.
How much does AI inference monitoring cost?
Costs vary by tool and scale; open-source stacks require engineering time to operate, while commercial and managed platforms charge based on data volume or are bundled into infrastructure pricing, as with NevTan Cloud.
Can you monitor GPU usage in real time?
Yes, using tools like NVIDIA DCGM for GPU-level telemetry, or platforms with built-in GPU observability such as NevTan Cloud, which surface utilization and VRAM metrics without additional setup.
What is the difference between latency and throughput?
Latency measures how long a single request takes to complete, while throughput measures how many requests the system can process in a given time period—both matter but optimize differently.
How do you monitor LLM token generation speed?
By tracking tokens per second (TPS) and time to first token (TTFT) at the model-serving layer, typically exposed as custom metrics in the inference server or platform dashboard.
What is a production AI monitoring checklist?
It should include latency and throughput tracking, GPU utilization monitoring, centralized logging, distributed tracing, alerting tied to SLOs, and a plan for capacity planning and continuous optimization.
Why should enterprises use a managed AI observability platform?
A managed platform reduces the engineering overhead of assembling and maintaining separate metrics, logging, and tracing tools, providing AI-specific observability out of the box with predictable costs.
Conclusion
Monitoring AI inference performance is what separates a production-grade AI system from a fragile one. Latency, throughput, GPU utilization, token generation speed, and error rates all need continuous visibility, tied to clear SLOs and backed by centralized logging, tracing, and alerting. Teams can assemble this themselves from open-source or commercial tools, or adopt a platform where observability is built into the infrastructure layer from the start.
Ready to monitor your AI workloads with enterprise-grade observability from day one? Get started with NevTan Cloud →